Who doesn’t like to be diversified? It’s one of the easiest words to throw around when pitching an investment product or process because the word has an almost perfectly positive connotation. I am guilty of overusing the term because it’s just so easy to throw around.
But diversification isn’t all peaches and cream. There is such a thing as being overdiversified. Take an index fund. It owns tons of stocks that will stink over the next year. Apple last year is a great example. It was the biggest stock in the S&P 500 (and therefore most impactful on returns), and had a relatively weak year.
Owning everything means you will always own certain types of stocks that tend to perform poorly. Let’s look at four such types, and then see how an index would perform if it first stripped out the worst stocks by these measures. Because market indexes are weighted by capitalization, I’ll focus on large stocks here.
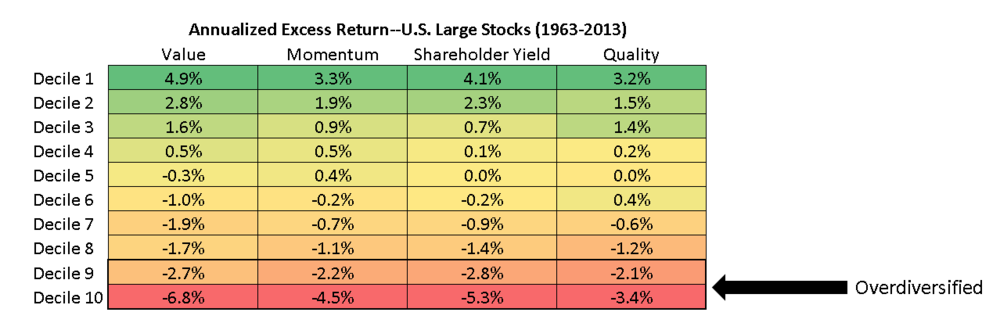
Value
Expensive stocks—those trading at high multiples of their sales, earnings, and cash flows—have been very poor performers historically. These are usually exciting companies, but the market expects too much of them, and when reality sets in, the stocks underperform. The most expensive stocks in the large stock universe (the worst 10%, rebalanced annually) have underperformed by 6.8% annually since 1963.
Momentum
Same story for the falling knives out there. Stocks whose recent returns have been among the worst in the market tend to continue to lose over the next year. Stocks with the worst momentum have underperformed by 4.5% annually since 1963.
Quality
Stocks with suspicious earnings quality—which tend to have very high accruals and weak cash flows—have also gotten beaten up over the years. Stocks with the worst earnings quality have underperformed by 3.4% annually since 1963.
Shareholder Yield (Dividends + Buybacks)
Stocks with the worst shareholder yield (meaning they are issuing shares and typically not paying a dividend) have also underperformed, by 5.3% annually.
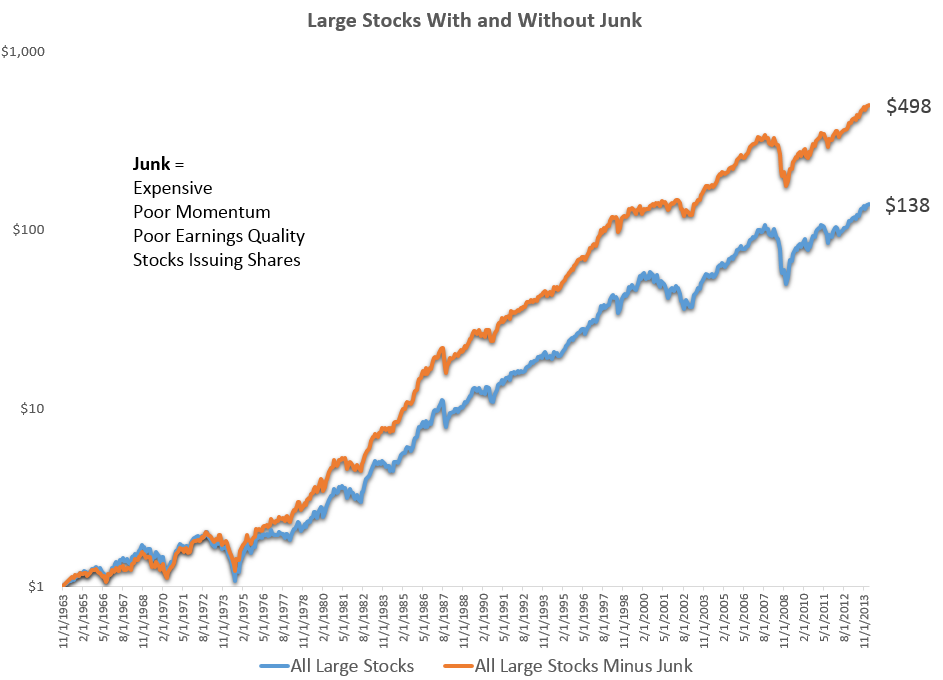
An Index without the Crap
So what would happen if we just refused to invest in expensive stocks, low quality stocks, stocks with poor price momentum, or stocks issuing shares? The results below illuminate what I mean by overdiversification. An equal weighted basket of all large stocks (junk included) has grown at an annual rate of 10.3% with an annual standard deviation of 15.9%, since 1963. If, instead, you stripped out stocks (annually) in the worst 20% of the market by value, momentum and quality, and also stripped out any stocks that were net issuers of shares (issuance – buybacks > 0), then you’d have achieved a much better result. This modified index would have grown at a 13.1% annual rate and done so with less volatility, with a standard deviation of 14.6%. You’d still own several hundred stocks, and be very diversified, but you’d have a smarter portfolio. Here is the historical growth of the two strategies. Diversification is good…to a point. But owning everything—even the junk—can be a drag on returns over the long term.
/rating_off.png "1 Star")
Totally agree, but why not take it further and only invest in the best 100 stocks? Also, any idea why this doesn’t exist as an efficient index fund?
Hmmm. And how would I invest in such a splendid index?
Supposing the data is accurate, and over the last 50 years applying this strategy would have resulted in an IRR around 3% greater than the S&P 500, before jumping ship from an index fund, we still need to ask the questions:
How likely is it that these premia will persist for the next 50 years (or whatever your investing time horizon is)?
What is the tax impact of holding such a portfolio? The ‘equal weighted’ part in particular scares me, since it will necessitate high portfolio turnover (compared to an index fund) to keep the weighting right, resulting in tax drag from capital gains.
What is the trading cost of such a portfolio? Again, the necessary high turnover will cost an investor a great deal in spreads and commissions over time.
- How easy is it to stick to such a plan? For the average investor, it would be a lot of work to regularly gather the required data and calculate the appropriate trades to make - the logical next step: an expert-run mutual fund that implements this strategy for you. What would the loads, expense ratio and 12B-1 fees look like?
Combining all of these seems likely to erode if not completely eliminate the 3% benefit such a strategy offers; and if nothing else, it adds a risk of tracking error (potentially leading to investor regret, and behavioral issues such as selling low), which is a risk not captured by historical standard deviation.
This seems to be a quantitatively-driven strategy, so let’s take a quantitative look at these drags on return by making some reasonable assumptions about a $100K portfolio following this approach:
we’ll be generous and assume there are no loads, and the all-inclusive fee for such a fund is 0.65%, so our starting point is an expected return premium of 2.4% compared to a no-load S&P500 mutual fund with an ER of 0.05% (such as VFIAX)
let’s assume that the realized long-term capital gains each year are around 10% of the portfolio value, and there are no short-term gains realized (the portfolio manager is happy to let the equal weighting requirement slide to avoid taxes).. 10% * 15% (LTCG rate) gives us a tax drag of 1.5%, our expected return premium is now 0.9%
if 2 trades are needed each month to maintain this strategy, and we pay $10 per trade, then we can cut off $240/year. That’s 0.24% of a $100,000 portfolio, so we’re down to an 0.66% premium
This is to say nothing of spreads, short-term gains distributions, taxes on dividends (which this strategy will resulting in more of), or the risk that these premia no longer persist, or at least do not do so with the same spread they once did (which seems not unlikely given the popularity of these kinds of strategies lately). No longer sounds quite so appealing!
Thoughts?
-Dave
Hey Dave, thanks for such a thoughtful reply! The post was intended more to highlight the consistent underperformance of certain types of stocks rather than suggest an actual portfolio. The portfolios I invest in personally take these concepts to a much more concentrated extreme (i.e. own just the top decile or even more concentrated than that). Those more concentrated portfolios have resulted in much better tested returns and better returns over very long live portfolio periods (after cost and after tax). I won’t get into specifics here about returns because I don’t talk products/business on here.
Hey Stephen. Such an index doesn’t exist and even if it did, I would still prefer more concentrated versions of the strategy…this post was more for illustrative purposes to show that certain types of stocks just tend to do poorly. results improve a lot when you just but stocks in the top deciles.
I’ll bet that this smart beta phenomenon produces some indexes that look similar to this, but I also think that a 100 stock (or even better, a 50 stock) version works better and makes more sense. That’s how I invest my own money, in concentrated versions of similar strategies using these same factors.
Great blog Patrick. Have you thought of adding insider buying/selling to the model?
Dave
What was your precise universe of "large cap stocks", the R1000?
It is just any stock with a market cap larger than average, don’t care about index membership. Today that would mean a minimum market cap of roughly 7.5B